1. Tutorials
RainfallQC contains five modules:
gauge_checks- For detecting abnormalities in summary and descriptive statistics.comparison_checks- For detecting abnormalities by comparing to benchmark data.timeseries_checks- For detecting abnormalities in patterns of the data record.neighbourhood_checks- For detecting abnormalities based on measurements in neighbouring gauges.pypwsqc_filters- For applying quality assurance protocols and filters for rainfall data from pyPWSQC
Each one of these modules contains individual QC check methods, which begin with the syntax check_.
For example to run a QC check that will check whether there are streaks of repeating values in your data, you can run: timeseries_checks.check_streaks(data, **kwargs).
Various example of errors in rainfall data can be viewed on this web map.
1.1. Getting started
1.1.1. What’s the format of your data?
How you use RainfallQC will depend on the format of your data. The table below outlines a few potential formats and how to use RainfallQC with them.
Data format |
See… |
Notes |
|---|---|---|
Single rain gauge (e.g. 1 CSV) |
Example 1 |
All RainfallQC checks were built to run on tabular data |
Rain gauge network data (e.g. 1 CSV with multiple columns) |
Example 2 |
You will need to define which of those gauges are considered to be neighbouring to a target gauge. Therefore you also need metadata with gauge locations. |
Rain gauge network data (multiple file paths) |
Example 3 |
Load in metadata with gauge locations, then read in only nearby gauges to a given target. |
Rain gauge data as xarray Dataset |
Example 4 |
If your data is in NetCDF format, for example. Be careful as you will lose metadata. |
Tablular data you want to convert to xarray for pyPWSQC |
Example 5 |
Required if you want to run pyPWSQC methods, but your data is CSVs. Sets your data’s time format and projection using deafults to create metadata. |
1.1.2. Which scenario best suits you?
Do you have a single rain gauge, or a whole network? Do you want to run a single check or use RainfallQC as part of a data processing pipeline? The table below outlines some common scenarios and advice on how to proceed.
Scenario |
Advice |
|---|---|
Running a single QC check |
See Examples 1-4 below. |
Running multiple QC checks on a single gauge |
Use the .apply_qc_framework() method. See Example 6 below. |
Running multiple QC checks on multiple gauges |
Use the .apply_qc_framework() method in a loop and store a summary. See Example 7 below. |
Defining your own sensitivity analysis |
You will need to create your own qc_framework specs. See Example 8 below. |
1.2. Examples
1.2.1. Example 1. - Running individual checks on a single rain gauge
Let’s say you have data for a single rain gauge stored in “hourly_rain_gauge_data.csv” which looks like this:
time |
rain_mm |
|---|---|
2020-01-01 00:00 |
0.0 |
2020-01-01 01:00 |
0.1 |
2020-01-01 02:00 |
0.0 |
2020-01-01 03:00 |
105.0 |
2020-01-01 04:00 |
0.6 |
… |
… |
For the majority of the checks in RainfallQC, you can load in your data using polars and run the checks directly. Below, we run 2 example QC checks:
check_intermittency- to flag years where there are periods of non-zero bounded by 0 (see Figure 1.),
daily_accumulations- to flag accumulations of hourly values into daily.

Figure 1. Example of an intermittency issue within the rainfall record
    import polars as pl
    from rainfallqc import gauge_checks, timeseries_checks

    data = pl.read_csv("hourly_rain_gauge_data.csv")

    intermittent_years = gauge_checks.check_intermittency(data, target_gauge_col="rain_mm")

    daily_accumulation_flags = timeseries_checks.check_daily_accumulations(
        data,
        target_gauge_col="rain_mm",
        gauge_lat=52.0,
        gauge_lon=2.0,
        smallest_measurable_rainfall_amount=0.1,
    )
Please note that some checks may require additional metadata, such as gauge location (latitude and longitude) or smallest measurable rainfall amount (e.g. 0.1 mm). This could look like:
station_id |
latitude |
longitude |
start_datetime |
end_datetime |
path |
|---|---|---|---|---|---|
rain_mm_gauge_1 |
53.0 |
2.0 |
2020-01-01 00:00 |
2024-01-01 00:00 |
path/to/gauge_1.csv |
rain_mm_gauge_2 |
54.1 |
-0.5 |
2018-01-01 00:00 |
2023-01-01 00:00 |
path/to/gauge_2.csv |
rain_mm_gauge_3 |
56.9 |
1.9 |
2015-01-01 00:00 |
2025-01-01 00:00 |
path/to/gauge_3.csv |
… |
… |
… |
… |
You could then run checks that require metadata i.e. the check_hourly_exceedance_etccdi_rx1day QC check which flags rainfall values exceeding
the hourly day rainfall 1-day record at a given location (see Figure 2):
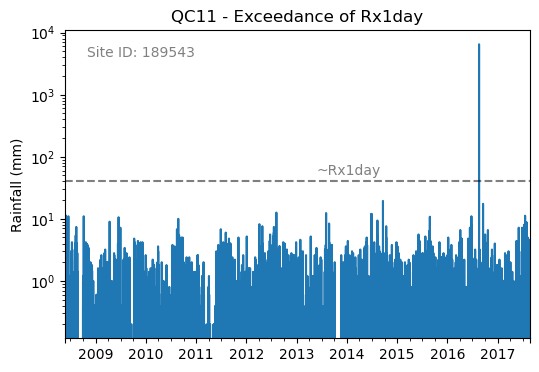
Figure 2. Example of an Rx1day check from the IntenseQC framework
The code for that check looks like:
    import polars as pl
    from rainfallqc import comparison_checks

    data = pl.read_csv("hourly_rain_gauge_data_gauge_1.csv")
    metadata = pl.read_csv("rain_gauge_metadata.csv")

    target_station_id = "rain_mm_gauge_1"
    target_metadata = metadata.filter(pl.col("station_id") == target_station_id)

    rx1day_check = comparison_checks.check_hourly_exceedance_etccdi_rx1day(
         data,
         target_gauge_col=target_gauge_col,
         gauge_lat=target_metadata["latitude"],
         gauge_lon=target_metadata["longitude"]
    )
Output flags will then look like:
time |
rx1day_check |
|---|---|
2020-01-01 00:00 |
0 |
2020-01-01 01:00 |
0 |
2020-01-01 02:00 |
0 |
2020-01-01 03:00 |
1 |
2020-01-01 04:00 |
0 |
… |
… |
1.2.2. Example 2. - Run individual checks on rain gauge network data (single file)
Let’s say you have data for a multiple rain gauge stored in “hourly_rain_gauge_network.csv” which looks like this:
time |
rain_mm_gauge_1 |
rain_mm_gauge_2 |
rain_mm_gauge_3 |
|---|---|---|---|
2020-01-01 00:00 |
0.0 |
0.5 |
0.0 |
2020-01-01 01:00 |
0.5 |
0.0 |
1.0 |
2020-01-01 02:00 |
0.0 |
1.0 |
0.0 |
2020-01-01 03:00 |
105.0 |
0.0 |
0.5 |
2020-01-01 04:00 |
0.0 |
0.5 |
0.0 |
… |
… |
… |
… |
You can then run checks that compare a target gauge to its neighbours.
To demonstrate, we use the check_wet_neighbours QC check from neighbourhood_checks.
This check will flag rainfall values that are in excess of a given number of the neighbours (see Figure 3.)
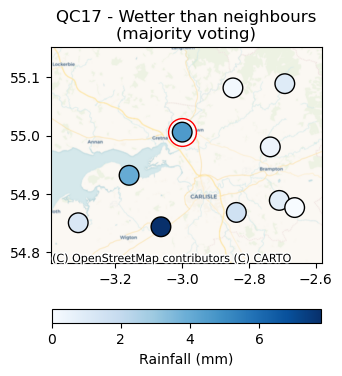
Figure 3. Wetter than neighbors check from the IntenseQC framework.
    import polars as pl
    from rainfallqc import neighbourhood_checks

    data = pl.read_csv("hourly_rain_gauge_network.csv")

    wet_neighbour_flags = neighbourhood_checks.check_wet_neighbours(
        data,
        target_gauge_col="rain_mm_gauge_1",
        list_of_nearest_stations=["rain_mm_gauge_2", "rain_mm_gauge_3"],
        time_res="hourly",
        wet_threshold=1.0, # threshold for rainfall intensity to be considered
        min_n_neighbours=1, # min number of neighbours needed for comparison
        n_neighbours_ignored=0, # number of neighbours to ignore for comparison
    )
Please note, you will need explicitly define which gauges are considered neighbouring to the target gauge. In Example 3, we show you how you can do this with the get_ids_of_n_nearest_overlapping_neighbouring_gauges function.
1.2.3. Example 3. - Run single checks on rain gauge network data (multiple file paths)
Sometimes you may have multiple rain gauge stored in seperate CSV files, and you do not necessarily want to load them all in at once. When this is the case, you need to have a metadata file to store filepaths. You can then use the get_ids_of_n_nearest_overlapping_neighbouring_gauges function to select only the nearest gauges to load in. See an example below where we assume all the CSVs look like example data 1 and the metadata like example metadata 1.
    import polars as pl
    from rainfallqc.utils.neighbourhood_utils import get_ids_of_n_nearest_overlapping_neighbouring_gauges

    data = pl.read_csv("hourly_rain_gauge_network.csv")
    metadata = pl.read_csv("rain_gauge_metadata.csv")

    target_station_id = "rain_mm_gauge_1"

    ten_nearest_neighbour_ids = get_ids_of_n_nearest_overlapping_neighbouring_gauges(
        metadata,
        target_id=target_station_id,
        distance_threshold=50,  # in km
        min_overlap_days=365*5,  # in days
        n_closest=10,  # number of neighbours to return
        start_datetime_col="start_datetime",
        end_datetime_col="end_datetime",
    )

    nearby_metadata = metadata.filter((pl.col('station_id').is_in(ten_nearest_neighbour_ids)) |
                                    (pl.col('station_id') == target_station_id))

    nearby_rainfall_data_list = []
    for path in nearby_metadata['path']:
        one_gauge = pl.read_csv(path, try_parse_dates=True)
        one_gauge = one_gauge.select(['time', 'rain_mm']) # assuming each file has these columns
        gauge_rain_col = path.split('/')[-1].split(f'.csv')[0] # create unique column name
        one_gauge = one_gauge.rename({'rain_mm': gauge_rain_col})
        nearby_rainfall_data_list.append(one_gauge)

    # Join all data together (consider 'how' to merge)
    nearby_rainfall_data = reduce(lambda left, right: left.join(right, on="time", how="left"), nearby_rainfall_data_list)
You can then run checks as normal with that data.
Let’s imagine we run the nearest neighbour correlation QC check (see Figure 4), so for that we also need to compute the nearest neighbour in our data.
To do this we can use the nearby_metadata calculated above and the compute_km_distances_from_target_id function:
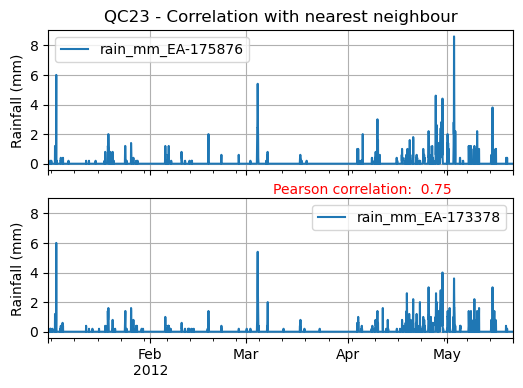
Figure 4. Nearest Neighbour correlation from IntenseQC framework.
    from rainfallqc import neighbourhood_checks
    from rainfallqc.utils.neighbourhood_utils import compute_km_distances_from_target_id

    # get nearest neighbour
    nearby_gauge_distances = compute_km_distances_from_target_id(nearby_metadata, target_id=target_station_id, station_id_col='station_id')
    nearest_neighbour_id = nearby_gauge_distances.sort('distance')[0]['station_id'].item()

    # run QC check
    neighbour_correlation = neighbourhood_checks.check_neighbour_correlation(
                                    nearby_rainfall_data,
                                    target_gauge_col=target_station_id,
                                    nearest_neighbour=nearest_neighbour_id
                                    )
1.2.4. Example 4. - Running check when your rain gauge is an xarray Dataset
There is not a ‘safe’ way to go between netCDF and a tabular format like Polars DataFrame because of the way that netCDFs store metadata, please keep this in mind.
Let’s imagine you have an xarray dataset like:
<xarray.Dataset> Size: 942MB
Dimensions:       (time: 219168, id: 134)
Coordinates:
  * time          (time) datetime64[ns] 2MB 2016-05-01T00:00:00 ... 2018-06-01
  * id            (id) <U6 3kB 'rain_gauge_1' 'rain_gauge_2' ... 'rain_gauge_133' 'rain_gauge_134'
    elevation     (id) <U3 2kB '12 m' '145 m' ... '59 m' '182 m' '516 m'
    latitude      (id) float64 1kB 52.31 52.3 ... 52.3 52.26
    longitude     (id) float64 1kB 4.671 4.675 ... 5.041 5.045
Data variables:
    rainfall      (time, id) float64 235MB 0.0 0.0 ... nan 0.0
Attributes:
    title:                 Example rain gauge network ...
    file author:           ...
    date:                  ...
    ...                    ...
Assuming the above data has been read in from “hourly_rain_gauge_data.nc”, we can convert this to a format that works with RainfallQC by selecting a single rain gauge as follows:
import polars as pl
import xarray as xr
from rainfallqc import gauge_checks, timeseries_checks

rain_gauge_ds = xr.open_dataset("hourly_rain_gauge_data.nc")

# Select only 1 rain gauge
gauge_1_ds = rain_gauge_ds.sel(id='rain_gauge_1')
gauge_1_ds = gauge_1_ds.resample(time="1h").sum(min_count=10)

rainfall_data_ds = gauge_1_ds['rainfall'].to_pandas().reset_index()
rainfall_data_pl = pl.DataFrame(rainfall_data_ds)

intermittent_years = gauge_checks.check_intermittency(
                         rainfall_data_pl,
                         target_gauge_col="rain_gauge_1"
                    )
1.2.5. Example 5. - Tabular data you want to convert to xarray for pypwsqc
By default, the methods from pyPWSQC require the inputs to be xarray datasets. Please note that an interface for running some of the pyPWSQC methods are embedded into RainfallQC already. For example you can run the station outlier check like:
import polars as pl
from rainfallqc.checks import pypwsqc_filters

network_data = pl.read_csv("hourly_rain_gauge_network.csv")
metadata = pl.read_csv("rain_gauge_metadata.csv")

# set metadata for xarray Dataset
TIME_UNITS = "seconds since 1970-01-01 00:00:00"
RAINFALL_ATTRIBUTES = {
    "name": "rainfall",
    "long_name": "rainfall amount per time unit",
    "units": "mm",
}
LAT_LON_ATTRIBUTES = {"unit": "degrees in WGS84 projection"}

station_outlier_flags = pypwsqc_filters.check_station_outlier(
                         network_data,
                         metadata,
                         neighbouring_gauge_ids=['rain_mm_gauge_1', 'rain_mm_gauge_2','rain_mm_gauge_3'],
                         neighbour_metadata_gauge_id_col="station_id",
                         time_res='hourly',
                         mmatch=200,
                         gamma=0.15,
                         n_stat=5,
                         max_distance_for_neighbours=5000, # metres
                         time_units=TIME_UNITS,
                         rainfall_attributes=RAINFALL_ATTRIBUTES,
                         lat_lon_attributes=LAT_LON_ATTRIBUTES
)
If you would like to convert the data to xarray (which is done behind the scenes by convert_neighbour_data_to_xarray function). Assuming your data is like example data 1, you can do that as follows.
    import polars as pl
    from rainfallqc import pypwsqc_filters

    data = pl.read_csv("hourly_rain_gauge_network.csv")
    metadata = pl.read_csv("rain_gauge_metadata.csv")

    # 0. metadata formatting globals
    TIME_UNITS = "seconds since 1970-01-01 00:00:00"
    GLOBAL_ATTRIBUTES = {"title": "GSDR", "year": "2025"}
    RAINFALL_ATTRIBUTES = {
        "name": "rainfall",
        "long_name": "rainfall amount per time unit",
        "units": "mm",
    }

    # 1. convert to xarray
    data_ds = data.to_pandas().set_index('time').to_xarray().to_array(dim="id")
    data_ds = data_ds.to_dataset(name="rainfall")

    # 2. assign lat and lon and elev as coordinates with the dimension id
    data_ds = data_ds.assign_coords(longitude=("id", metadata['longitude'].to_numpy()),
                                  latitude=("id", metadata['latitude'].to_numpy()),
                                  )

    # 3. set encoding attribute for time
    data_ds.time.encoding['units'] = TIME_UNITS
    data_ds['time'] = data_ds['time'].assign_attrs({"unit": TIME_UNITS})


    # 4. Assign attributes
    data_ds['rainfall'] = data_ds['rainfall'].assign_attrs(RAINFALL_ATTRIBUTES)
    data_ds['longitude'] = data_ds['longitude'].assign_attrs({"units": "degrees in WGS84 projection"})
    data_ds['latitude'] = data_ds['latitude'].assign_attrs({"units": "degrees in WGS84 projection"})
    data_ds = data_ds.assign_attrs(GLOBAL_ATTRIBUTES)
After following the above step to create data_ds, you can then run methods from pyPWSQC.
1.2.6. Example 6. - Running multiple QC checks on a single target gauge
To run multiple QC checks, you can use the apply_qc_framework() method to run QC methods from a given framework (e.g. IntenseQC).
Let’s say you have hourly rainfall values from a rain gauge network data like example data 2 and metadata like example metadata 1. You can then run multiple QC checks at once by defining a QC framework, the methods to run and parameters for those methods.
As of RainfallQC v0.3.0, there are three QC frameworks:
“intenseqc” - All 25 checks from IntenseQC/GSDR-QC with names like: “QC1”, “QC2” … “QC25”,
“pypwsqc” - 2 checks from pyPWSQC with the names: “FZ” and “SO”,
“custom” - Allows the user to select a custom set of checks (see Example 8).
Let’s run some QC checks from intenseqc framework below:
    import polars as pl
    from rainfallqc.qc_frameworks import apply_qc_framework

    network_data = pl.read_csv("hourly_rain_gauge_network.csv")
    metadata = pl.read_csv("rain_gauge_metadata.csv")

    # 1. Decide which QC methods of IntenseQC will be run
    qc_framework = "IntenseQC"
    qc_methods_to_run = ["QC1", "QC8", "QC9", "QC10", "QC11", "QC12", "QC14", "QC15", "QC16"]

    # 2. Determine nearest neighbouring gauges for neighbourhood checks
    gauge_lat = gpcc_metadata["latitude"]
    gauge_lon = gpcc_metadata["longitude"]
    nearest_neighbourhours = ["rain_mm_gauge_2", "rain_mm_gauge_3", ...] # or see Example 3 if not determined

    # 2 Decide which parameters for QC
    qc_kwargs = {
        "QC1": {"quantile": 5},
        "QC14": {"wet_day_threshold": 1.0, "accumulation_multiplying_factor": 2.0},
        "QC16": {
            "list_of_nearest_stations": nearest_neighbourhours,
            "wet_threshold": 1.0,
            "min_n_neighbours": 5,
            "n_neighbours_ignored": 0,
        },
        "shared": {
            "target_gauge_col": "rain_mm_gauge_1",
            "gauge_lat": gauge_lat,
            "gauge_lon": gauge_lon,
            "time_res": "daily",
            "smallest_measurable_rainfall_amount": 0.1,
        },
    }

    # 3. Run QC methods on network data
    qc_result = apply_qc_framework.run_qc_framework(
        daily_rain_gauge_network, qc_framework=qc_framework, qc_methods_to_run=qc_methods_to_run, qc_kwargs=qc_kwargs
    )
Because lots of the checks share the same parameters with a standard vocabulary, you can use the “shared” part of the qc_kwargs dictionary to set those.
1.2.7. Example 7. - Looping through rain gauges and running multiple QC checks
This example is a little more involved and less well-explained (please email me: tomkee@ceh.ac.uk if you have any questions).
This example shows you to run a loop over multiple gauges and how to store the outputs of the QC checks. How you store things depends on the use-case. Below, we give an example of storing a summary of the QC runs as the number of rows with flags for each check. Some of the checks from RainfallQC do not return rows, but instead numbers or lists. So first, we need to decide which checks will run, and which of those are row-wise.
from rainfallqc.qc_frameworks.inbuilt_qc_frameworks import NON_ROWWISE_QC_CHECKS, NON_ROWWISE_QC_CONVERTER

DATA_RESOLUTION = 0.2
MIN_N_NEIGHBOURS_FOR_CALC = 8

# Specificiations for QC run (NOTE: QC6 is heavy as using Pettit test)
qc_to_run = ["QC1", "QC2", "QC3", "QC4", "QC5", "QC7", "QC8",
            "QC9", "QC10", "QC11", "QC12", "QC13", "QC14",
            "QC15", "QC17", "QC19", "QC21", "QC22", "QC23"]


qc_kwargs = {
    "QC1": {"quantile": 5},
    "QC2": {"k": 3},
    "QC3": {"time_granularity": "hour"},
    "QC4": {"time_granularity": "weekday"},
    "QC5": {"no_data_threshold" : 2}, # days
    "QC7": {"expected_min_val": DATA_RESOLUTION},
    "QC13": {"accumulation_multiplying_factor": 2.0},
    "QC14": {"accumulation_multiplying_factor": 2.0},
    "shared": {
        "time_res": "hourly",
        "smallest_measurable_rainfall_amount": DATA_RESOLUTION,
        "wet_threshold": 1.0,
        "min_n_neighbours": MIN_N_NEIGHBOURS_FOR_CALC,
        "n_neighbours_ignored": 0
    }
}

# all checks that are computed as summary of overall data or once per year (so not one flag for every data point)
non_rowwise_checks = NON_ROWWISE_QC_CHECKS
non_rowwise_checks_converter = NON_ROWWISE_QC_CONVERTER
We will also need a function/class that will load in our nearby_metadata for each gauge (based on code from Example 3). Please note that this makes very specific assumptions about the format of the data, and this may be different for your own purposes.
from functools import reduce

def load_gauge_neighbour_metadata_and_data(target_station_id, metadata):
    """
    Loads metadata and rainfall data from 10 nearest neighbours to a given target gauge
    """
    ten_nearest_neighbour_ids = get_ids_of_n_nearest_overlapping_neighbouring_gauges(
        metadata,
        target_id=target_station_id,
        distance_threshold=50,  # in km
        min_overlap_days=365*5,  # in days
        n_closest=10,  # number of neighbours to return
        start_datetime_col="start_datetime",
        end_datetime_col="end_datetime",
    )

    nearby_metadata = metadata.filter((pl.col('station_id').is_in(ten_nearest_neighbour_ids)) |
                                    (pl.col('station_id') == target_station_id))

    nearby_rainfall_data_list = []
    for path in nearby_metadata['path']:
        one_gauge = pl.read_csv(path, try_parse_dates=True)
        one_gauge = one_gauge.select(['time', 'rain_mm']) # assuming each file has these columns
        gauge_rain_col = path.split('/')[-1].split(f'.csv')[0] # create unique column name
        one_gauge = one_gauge.rename({'rain_mm': gauge_rain_col})
        nearby_rainfall_data_list.append(one_gauge)

    # Join all data together (consider 'how' to merge)
    nearby_rainfall_data = reduce(lambda left, right: left.join(right, on="time", how="left"), nearby_rainfall_data_list)

    return nearby_metadata, nearby_rainfall_data
Next, we can begin the loop, which in turn is going load data in from file paths and overwrite some of the keyword arguments in qc_kwargs
such as setting a new “target_gauge_col” each time.
We assume the data is stored in seperate CSV files (like example data 1) and there is metadata with paths to that data like example metadata 2 (see Example 3 also).
Advice, you may want to include try and except statements to capture rain gauges that may throw errors.
My plan is to update this example after some feedback.
More advice because this example assumes the data is hourly, the data is explicitly upsampled to ‘hourly’ in the loop with the Polars method .upsample("time", every="1h")
    import polars as pl
    from rainfallqc.qc_frameworks import apply_qc_framework

    network_data = pl.read_csv("hourly_rain_gauge_network.csv")
    metadata = pl.read_csv("rain_gauge_metadata.csv")

    overall_summary_of_qc = []

    # begin loop
    for station_id in metadata['station_id'].unique():
        nearby_metadata, nearby_rainfall_data = load_gauge_neighbour_metadata_and_data(target_station_id=station_id, metadata=metadata)

        target_gauge_col = station_id

        # get nearest neighbour
        nearby_gauge_distances = compute_km_distances_from_target_id(nearby_metadata, target_id=target_station_id, station_id_col='station_id')
        if len(nearby_gauge_distances) == 0:
            print(station_id, "no neighbours skipping")
            continue
        nearest_neighbour_id = nearby_gauge_distances.sort('distance')[0]['station_id'].item()

        # Update all the shared keyword arguments
        qc_kwargs["shared"]["rain_col"] = target_gauge_col
        qc_kwargs["shared"]["target_gauge_col"] = target_gauge_col
        qc_kwargs["shared"]["nearest_neighbour"] = nearest_neighbour_id
        qc_kwargs["shared"]["list_of_nearest_stations"] = nearby_rainfall_data.columns[1:]
        qc_kwargs["shared"]["gauge_lat"] = nearby_metadata.filter(pl.col("station_id") == target_gauge_col)['latitude']
        qc_kwargs["shared"]["gauge_lon"] = nearby_metadata.filter(pl.col("station_id") == target_gauge_col)['longitude']

        # Try to run the apply QC framework
        try:
            result = rainfallqc.apply_qc_framework.run_qc_framework(
                data=nearby_rainfall_data.upsample("time", every="1h"),
                qc_framework='IntenseQC',
                qc_methods_to_run=qc_to_run,
                qc_kwargs=qc_kwargs,
            )
        except Exception as e:
            print(station_id, e)
            continue

        # join all flags together for the given target rain gauge
        all_flags = {}
        all_flags['all_flags_by_row'] = nearby_rainfall_data["time", target_gauge_col]
        for qc in result:
            if isinstance(result[qc], pl.DataFrame):
                try:
                    all_flags['all_flags_by_row'] = all_flags['all_flags_by_row'].join(result[qc], on="time")
                except Exception as e:
                    print(e, station_id)
            else:
                all_flags[qc] = result[qc]

        # Calculate summary statistics of flags
        all_flags['all_flags_by_row'] = all_flags['all_flags_by_row'].with_columns(
            pl.when(
                pl.any_horizontal(pl.all().exclude(["time", target_gauge_col]).fill_null(0.0).map_elements(lambda col: col > 0))
            )
                .then(1)
                .otherwise(0)
                .alias("is_flagged")
        )
        flagged_rows = all_flags['all_flags_by_row']['is_flagged'].value_counts().filter(pl.col("is_flagged") == 1)['count']
        not_flagged_rows = all_flags['all_flags_by_row']['is_flagged'].value_counts().filter(pl.col("is_flagged") == 0)['count']
        total_rows = flagged_rows + not_flagged_rows
        perc_flagged = ((flagged_rows/total_rows)*100)
        perc_flagged = perc_flagged.item() if perc_flagged.len() == 1 else 0
        print(f"Station ID: {station_id}\t\tFlag rate: {perc_flagged: .2f}%")

        # add to overall QC summary

        summary_of_qc = {}
        summary_of_qc['gauge_id'] = target_gauge_col
        summary_of_qc['num_nearby_gauges'] = len(nearby_metadata) - 1 # do not count the target
        summary_of_qc['perc_flagged'] = round(perc_flagged, 3)
        summary_of_qc['total_flagged_rows'] = flagged_rows[0] if flagged_rows.len() > 0 else 0
        summary_of_qc['total_rows'] = len(all_flags['all_flags_by_row'])

        for qc_key in non_rowwise_checks:
            if isinstance(all_flags[qc_key], list):
                # sum number of years flagged
                summary_of_qc[non_rowwise_checks_converter[qc_key]] = sum(item != 0 for item in all_flags[qc_key])
            else:
                summary_of_qc[non_rowwise_checks_converter[qc_key]] = all_flags[qc_key]

        for col in all_flags['all_flags_by_row'].columns[2:]:
            summary_of_qc[col] = len(all_flags['all_flags_by_row'].filter(pl.col(col) > 0).drop_nans()[col])
        overall_summary_of_qc.append(summary_of_qc)
1.2.8. Example 8. - Running a sensitivity analysis
As shown in Example 6-7, to run multiple QC checks, you can use the apply_qc_framework().
This method also allows a “custom” framework to be user-defined.
In the below example, we will define a custom_framework that runs two different variations of the same
QC check. That check will be check_min_val_change which flags when there is shifts in the gauge data from the expected minimum values (see Figure 5 for example of minimum values by year).
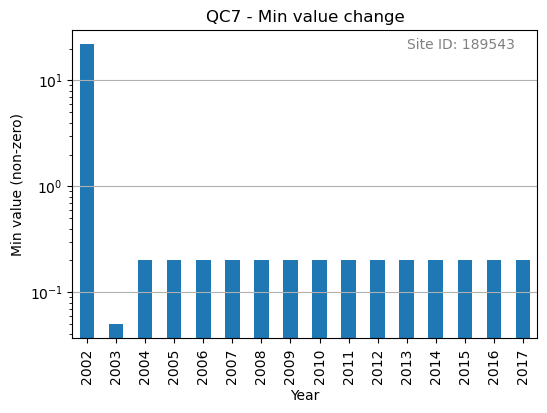
Figure 5. Minimum non-zero rainfall amounts each year.
We will check min values of 0.1 and 0.2 mm as part of our “custom” framework:
    import polars as pl
    from rainfallqc.qc_frameworks import apply_qc_framework

    network_data = pl.read_csv("hourly_rain_gauge_network.csv")

    # Define your custom framework
    custom_framework = {
        "CustomQC_check_1": {
            "function": gauge_checks.check_min_val_change,
        },
        "CustomQC_check_2": {
            "function": gauge_checks.check_min_val_change,
        },
    }

    qc_methods_to_run = ["CustomQC_check_1", "CustomQC_check_2"]

    qc_kwargs = {
        "CustomQC_check_1": {"expected_min_val": 0.1},
        "CustomQC_check_2": {"expected_min_val": 0.2},
        "shared": {"target_gauge_col": f"rain_gauge_1"},
    }

    # Run custom framework
    result = apply_qc_framework.run_qc_framework(
        network_data,
        qc_framework="custom", ## Set the user defined QC framework
        qc_methods_to_run=qc_methods_to_run,
        qc_kwargs=qc_kwargs,
        user_defined_framework=custom_framework,
    )
Real coding example for RainfallQC are available as Jupyter Notebooks at: https://github.com/Thomasjkeel/RainfallQC-notebooks/tree/main